
What is the Smart Money Concept?
If you have spent any time in trading circles, on YouTube, or in trading communities, you have probably heard the phrase Smart Money Concept — or SMC. It comes up constantly.
But what does it actually mean? And more importantly, is it something a complete beginner can learn and use?
The short answer is yes. In fact, the Smart Money Concept is one of the most powerful and practical frameworks available to traders of all levels — precisely because it is based on how markets actually work, not on lagging indicators or guesswork.
In this guide, you will learn exactly what the Smart Money Concept is, where it comes from, what the core tools are, and how you can start applying it in your own trading — even as a complete beginner.
What you will learn in this article
• What the Smart Money Concept is and where it comes from • Who the institutional traders ('Smart Money') are • The 6 core SMC concepts every trader must know • How SMC compares to traditional technical analysis • How to start using SMC as a beginner • Where to learn SMC with live professional guidance
What is the Smart Money Concept?
The Smart Money Concept (SMC) is a trading methodology built around one core idea: the financial markets are not random. They are driven by large institutional participants — banks, hedge funds, central banks, and investment firms — who move enormous amounts of capital and leave recognisable footprints in price action.
The term 'Smart Money' refers to these institutional players. They are called smart money because they have access to superior information, technology, and capital compared to the average retail trader. When these institutions enter or exit the market, they create specific patterns that trained eyes can identify — and trade alongside.
By contrast, most retail traders — the individual traders on platforms like MetaTrader or TradingView — are often on the wrong side of these moves. They enter too late, place stop losses in predictable locations, and get swept out of trades by institutional activity. The SMC approach teaches you to stop trading against this institutional flow and start trading with it.
Who are the Institutional Traders?
To understand the Smart Money Concept, it helps to understand who the institutional players actually are and why their activity is so significant.
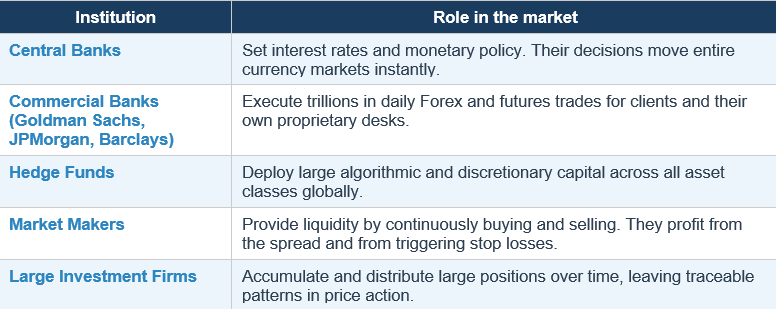
These institutions cannot simply place a buy order for 10 billion dollars in one click. They need to accumulate their position over time, often disguising their activity to avoid moving the market against themselves. This process of accumulation, manipulation, and distribution is precisely what SMC traders learn to read.
The 6 Core Smart Money Concept Tools
The Smart Money Concept is built on six foundational concepts. Once you understand these, you will begin to see markets in a completely different way.
1. Market Structure
Market structure is the foundation of SMC analysis. It describes the way price moves within trends and provides the framework for understanding whether an asset is bullish (rising), bearish (falling), or in consolidation.
The key markers:
• Uptrend: Price forms Higher Highs (HH) and Higher Lows (HL) — buyers are in control
• Downtrend: Price forms Lower Highs (LH) and Lower Lows (LL) — sellers are in control
• Consolidation: Price moves sideways in a range — neither side is dominant
Understanding market structure tells you which direction to look for trades. You should always trade in alignment with the dominant market structure, not against it.
2. Liquidity
Liquidity is one of the most important — and most misunderstood — concepts in SMC. In this context, liquidity refers to areas in the market where large numbers of stop-loss orders are clustered.
Here is why this matters: when retail traders place trades, they tend to put their stop losses in very predictable places — just below recent swing lows, just above recent highs, or at round numbers. Institutional traders know this. They deliberately push price into these areas to trigger those stop losses, which releases a flood of buy or sell orders. The institution then enters its own large position using this newly created liquidity.
This process is called a liquidity sweep or stop hunt. Once you know what to look for, you will start recognising these moves everywhere.
Key insight:
The market does not move randomly. It moves purposefully toward areas where liquidity — clusters of stop-loss orders — is waiting to be collected. Understanding this changes everything about how you read charts.
3. Order Blocks
An order block is a price zone where an institutional trader previously placed a large order. These zones act as significant support or resistance levels — and they are far more powerful than the traditional support/resistance lines most retail traders draw.
A bullish order block is typically identified as the last bearish (red/down) candle before a strong upward move. A bearish order block is the last bullish (green/up) candle before a strong downward move. These zones often represent where institutional buying or selling occurred, and price frequently returns to these areas before continuing in the original direction.
Entering a trade at an order block gives you a high-probability entry with a tight stop loss — the foundation of professional risk management
4. Fair Value Gaps (FVG)
A Fair Value Gap occurs when price moves so quickly in one direction — often driven by a large institutional order — that it creates a visible gap or imbalance in the chart. This gap represents an area where normal price discovery did not occur.
Markets have a strong tendency to return to these gaps to 'fill' the imbalance before continuing in the original direction. For traders, this means Fair Value Gaps act as high-probability target zones and entry areas.
On most charts, an FVG appears as a three-candle pattern where the first and third candle's wicks do not overlap — leaving a visible space between them.
5. Break of Structure (BOS)
A Break of Structure (BOS) occurs when price moves beyond a previous significant swing high (in an uptrend) or below a previous significant swing low (in a downtrend). A BOS is a confirmation signal — it tells you the current trend is likely to continue in the same direction.
In practical terms: if you are looking for buying opportunities and you see price create a BOS to the upside, this confirms bullish momentum. You can now look for entries on pullbacks to key levels such as order blocks or fair value gaps.
6. Change of Character (CHoCH)
A Change of Character (CHoCH) is the opposite of a BOS — it is an early warning signal that the current trend may be reversing. A CHoCH occurs when price breaks in the opposite direction to the prevailing trend for the first time.
For example: in an uptrend, price has been forming higher highs and higher lows. If price suddenly breaks below a previous higher low, this is a Change of Character — it suggests that sellers are beginning to take control and a reversal may be forming.
The CHoCH is particularly powerful because it alerts you to potential reversals early, before the new trend is fully confirmed. This gives you the opportunity to either exit existing positions or prepare for a new directional trade.
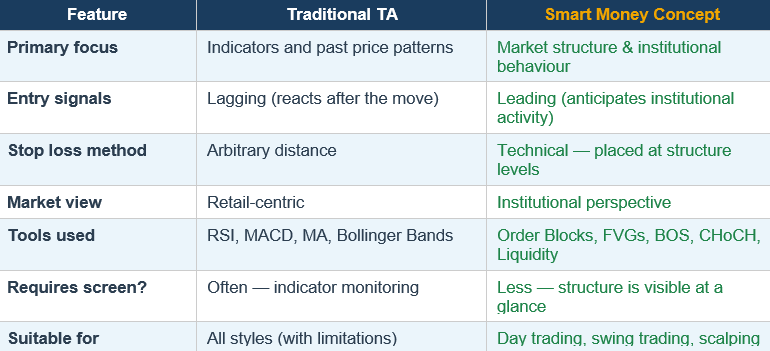
SMC vs Traditional Technical Analysis: What's the Difference?
Most beginner traders are introduced to traditional technical analysis — tools like moving averages, RSI, MACD, and Bollinger Bands. These are useful tools, but they share a fundamental limitation: they are all lagging indicators. They react to price after the move has already happened.
The Smart Money Concept takes a fundamentally different approach. Instead of reacting to past price data, it teaches you to read the current structure of the market and anticipate where institutional activity is likely to occur next.
How Do You Start Using the Smart Money Concept?
One of the most common questions beginners ask is: 'Where do I start?' The good news is that the SMC approach — while powerful — is learnable by anyone willing to study the right material in the right sequence.
Here is the recommended learning path for complete beginners:
1. Start with Market Structure. Before anything else, learn to identify uptrends, downtrends, and consolidation. Practice marking swing highs and swing lows on historical charts. This is the lens through which all other SMC concepts are viewed.
2. Learn to identify Liquidity. Study charts and mark areas where stop losses are likely to be clustered — swing highs, swing lows, equal highs, and equal lows. With practice, you will develop an instinct for where liquidity is hiding.
3. Study Order Blocks. Once you can identify the market structure, focus on finding order blocks — the last opposing candle before a significant move. Mark these on your charts and observe how price reacts when it returns to these zones.
4. Add Fair Value Gaps. Look for imbalances in price — three-candle patterns where a gap exists. Note how price frequently returns to fill these gaps. This becomes a key tool for both entries and targets.
5. Practise with a Demo Account. Do not risk real money until you have built confidence and consistency through paper trading. TradingView offers a free built-in paper trading simulator — use it extensively before going live.
6. Keep a Trading Journal. Record every trade: entry and exit, the reason for the trade, the outcome, and what you could have done better. Journaling accelerates your learning faster than any other single practice.
Important reminder:
SMC is a skill, not a system you install. Like any professional skill — surgery, architecture, coding — it requires study, practice, and feedback. The traders who succeed are not the ones who find the 'best signal'. They are the ones who build a structured process and follow it consistently.
Common Mistakes Beginners Make with SMC
Understanding what to avoid is just as valuable as knowing what to do. Here are the most common pitfalls beginners encounter when learning the Smart Money Concept:
• Over-marking the chart. A common beginner mistake is marking every possible order block, FVG, and liquidity level on the chart until it becomes unreadable. Focus on the key levels from higher timeframes — less is more.
• Trading against the higher timeframe bias. SMC is a top-down methodology. Always identify the trend on the Daily or 4-hour chart first, then look for entries on lower timeframes in the direction of that trend.
• Ignoring risk management. Even with the best SMC analysis, you will have losing trades. The 1–2% risk rule is non-negotiable. Without it, even the best strategy will fail.
• Expecting every candle to be explainable. Not every price move has a clear SMC explanation. Some movements are noise. The goal is to identify high-probability setups, not to explain every tick.
Skipping the practice phase. Reading about SMC is not the same as seeing it in real markets. You need hundreds of hours of chart time — ideally on a demo account — before your pattern recognition becomes reliable.
FREE DOWNLOAD
5 Mistakes Every Beginning Trader Makes
Most beginners make at least 3 of these. Each one costs time, money, and confidence. The guide is free — download it before you place your next trade.
Conclusion: Start Trading With the Smart Money, Not Against It
The Smart Money Concept is not a magic formula. It will not make you profitable overnight. But it is arguably the most honest and effective approach to understanding why markets move — and it is completely learnable by anyone willing to do the work.
The core insight of SMC is deceptively simple: stop trying to predict the market, and start reading what the institutional players are doing. Follow the footprints. Trade with the smart money.
If this resonates with you — if you are ready to build a proper trading foundation instead of chasing signals and guessing — then Trading Fundamentals at CareerIT Trader Academy is exactly where your journey should begin
Ready to start trading the right way?
Join the Trading Fundamentals course at CareerIT Trader Academy.
5 live sessions · Starting July 07, 2026
Navigation
Home
Trading courses
IT courses
About us
Contact
CareerIT
support@careerit-solutions.com
Mobile & WhatsApp: +597 8974286
Paramaribo, Suriname
CareerIT Solutions 2026